
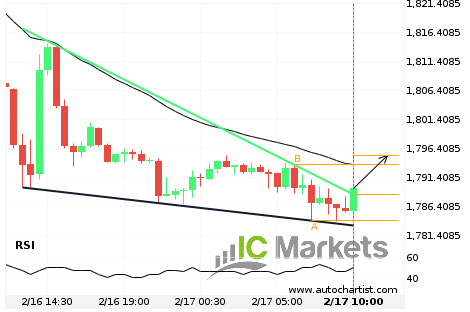
Resistance line breached by GOLD
GOLD has broken through the resistance line which it has tested twice in the past. We have seen it retrace from this position before, so one should wait for confirmation of the breakout before trading. If this new trend persists, a target line of around 1795.0855 can be expected within the next 6 hours.

What’s going on with USDCHF?
Those of you that are trend followers are probably eagerly watching USDCHF to see if its latest 0.78% move continues. If not, the mean-reversion people out there will be delighted to cash in on this exceptionally large 22 hours move.

US Tech 100 Index จะมีโมเมนตัมเพียงพอที่จะเบรค แนวรับได้หรือไม่?
US Tech 100 Index กำลังมุ่งหน้าไปที่เส้นแนวรับของ ช่องแบบขึ้น และสามารถไปถึงจุดนี้ได้ภายในช่วง 2 วันถัดไป ราคาได้มาทดสอบเส้นนี้หลายครั้งแล้วในอดีต และครั้งนี้อาจไม่แตกต่างจากในอดีตซึ่งจบลงด้วยการรีบาวน์แทนที่จะเกิดการเบรค ถ้าหากการเบรคยังไม่เกิดขึ้น เราจะสามารถเห็นการย่อตัวลงไปสู่ระดับปัจจุบันได้

Grande Movimento USDCHF
USDCHF experimentou um 0.78% em alta movimento no(a) último(a) 22 horas.
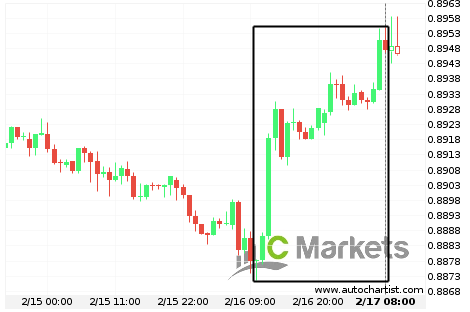
กำลังมีอะไรเกิดขึ้นกับ USDCHF?
ผู้ที่ติดตามแนวโน้มกำลังอยากเห็นว่าการเคลื่อนตัว 0.78% ของ USDCHF จะเดินหน้าไปต่อได้หรือไม่ ถ้าไม่ได้ ผู้คนส่วนนึงอาจต้องการทำกำไรออกมาสำหรับการเคลื่อนตัวขนาดใหญ่ในช่วง 22 ชั่วโมง นี้

GOLD Nível visado: 1795.0855
Cunha descendente quebrou na linha de resistência em 17-fev-2021 10:00 UTC. Possível previsão de movimento em alta nos próximos 6 horas para 1795.0855

มีการทะลุผ่านเส้น แนวต้าน โดย GOLD
GOLD ได้ทะลุผ่านเส้น แนวต้าน ซึ่งได้ถูกทดสอบมาแล้วสองครั้งก่อนหน้านี้ เราได้เห็นการย่อตัวลงมาจากตำแหน่งนี้มาก่อน เทรดเดอร์ควรรอสัญญาณยืนยันของการเทรดก่อนทำการเทรด ถ้าหากแนวโน้มนี้ยังคงดำเนินต่อไป เราสามารถคาดหวังเส้นเป้าหมายที่ 1795.0855 ได้ภายในช่วง 6 ชั่วโมงถัดไป

¿Qué está ocurriendo con el USDCHF?
Aquellos de ustedes que sean seguidores de tendencia probablemente estarán observando ansiosamente al USDCHF para comprobar si el último movimiento de un 0,78% continúa. Si no lo hace, las personas fieles al método de reversió de la media estarán encantadas de ganar con este excepcional movimiento en 22 horas.
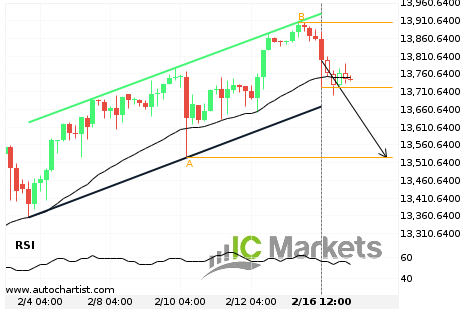
¿Tendrá el US Tech 100 Index suficiente impulso como para irrumpir el soporte?
El US Tech 100 Index se dirige hacia la línea de soporte de un Canal alcista y puede alcanzar este punto en las próximas 2 días. Ha probado esta línea ya en numerosas ocasiones en el pasado, y esta vez no tendría porqué ser diferente y terminar con una recuperación en lugar de una irrupción. […]

US Tech 100 Index Nível visado: 13525.3500
Canal ascendente identificado em 16-fev-2021 12:00 EST. Este padrão está ainda em processo de formação. Possível previsão de movimento em baixa para o nível de 13525.3500 no próximo 2 dias.